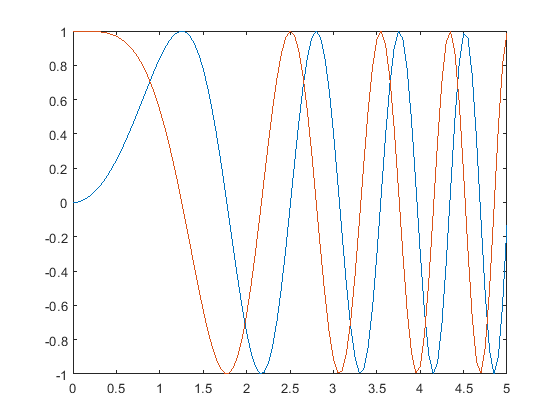
1 线图
x = 0:0.05:5;
y1 = sin(x.^2);
y2 = cos(x.^2);
plot(x,y1,x,y2)
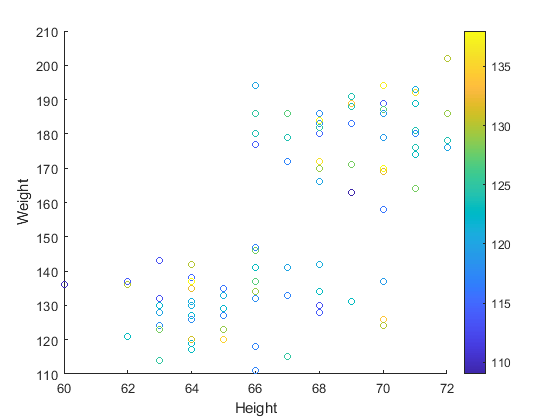
2 散点图
load patients Height Weight Systolic    % load data
scatter(Height,Weight,20,Systolic)      % color is systolic blood pressure
xlabel('Height')
ylabel('Weight')
colorbar
3 条形图
bar 函数用来创建垂直条形图。barh 函数用来创建水平条形图。
x = 0:0.05:5;
y1 = sin(x.^2);
y2 = cos(x.^2);
plot(x,y1,x,y2)
colorbar
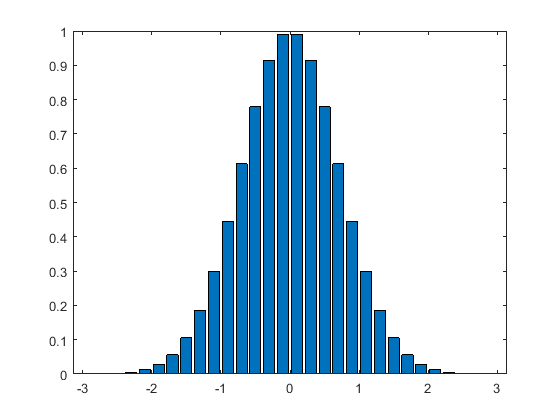
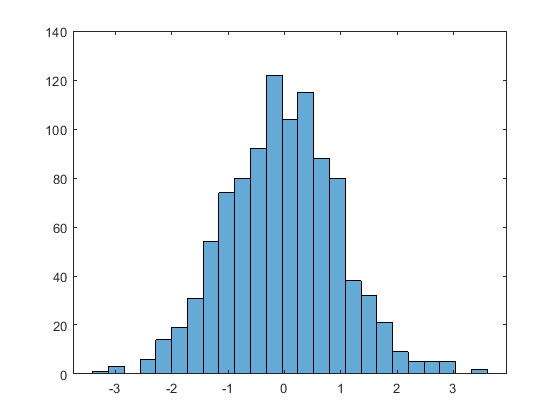
4 直方图
x = randn(1000,1);
nbins = 25;
h = histogram(x,nbins)
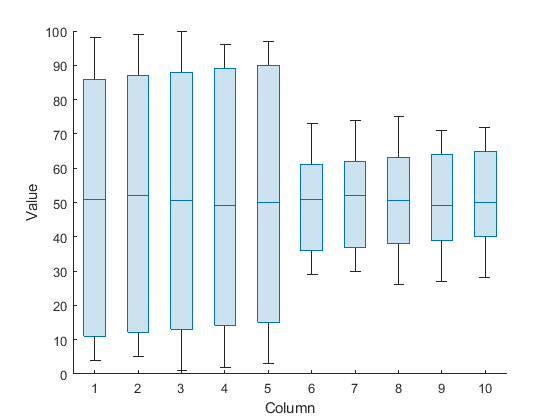
5 箱线图
Y = magic(10);
boxchart(Y)
xlabel('Column')
ylabel('Value')
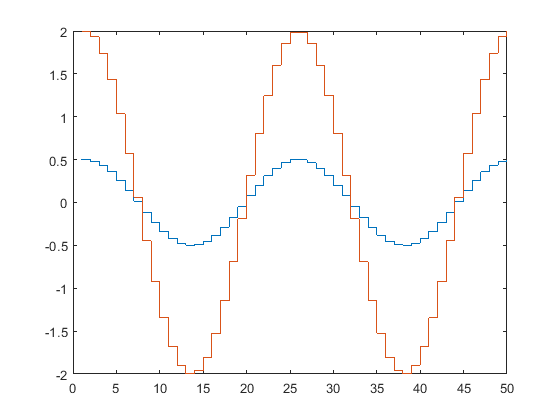
6 阶梯图
X = linspace(0,4*pi,50)';
Y = [0.5*cos(X), 2*cos(X)];

figure
stairs(Y)
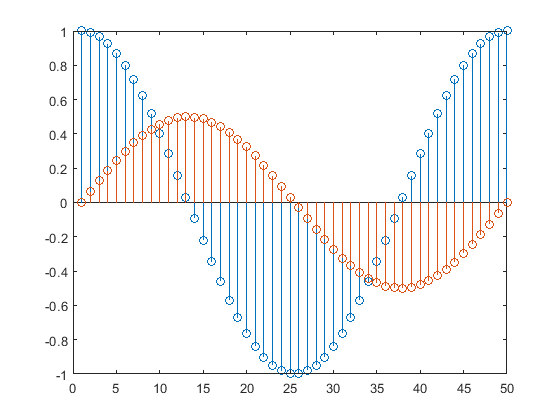
7 针状图
X = linspace(0,2*pi,50)';
Y = [cos(X), 0.5*sin(X)];
stem(Y)
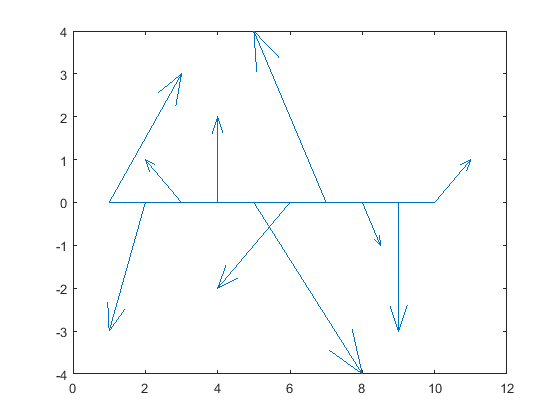
8 羽状图
Z = [2+3i -1-3i -1+i 2i 3-4i -2-2i -2+4i 0.5-i -3i 1+i];
feather(Z)
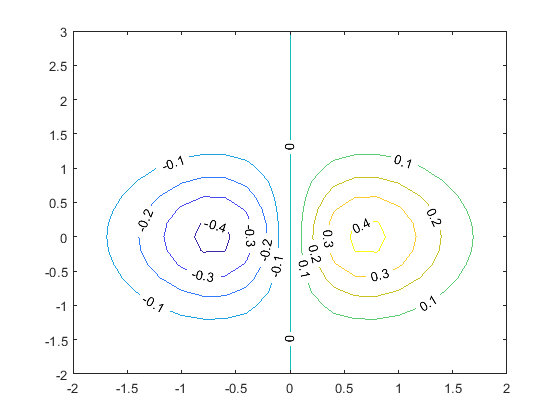
9 等高线图
x = -2:0.2:2;
y = -2:0.2:3;
[X,Y] = meshgrid(x,y);
Z = X.*exp(-X.^2-Y.^2);
% 通过将 `ShowText` 属性设置为 `'on'` 来显示标签
contour(X,Y,Z,'ShowText','on')
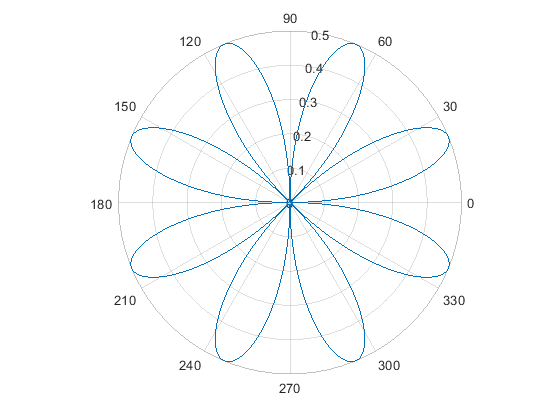
10 极坐标图
theta = 0:0.01:2*pi;                      % angle
rho = abs(sin(2*theta).*cos(2*theta));    % radius
polarplot(theta,rho)
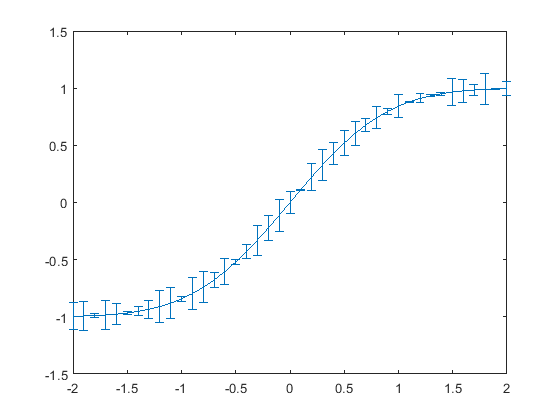
11 误差条形图
绘制 x 和 y 值的线图并在每个观察点上叠加垂直误差条
x = -2:0.1:2;
y = erf(x);
eb = rand(size(x))/7;
errorbar(x,y,eb)
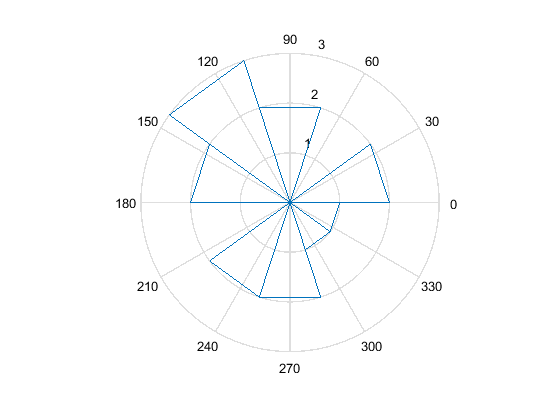
12 角度直方图
theta = [0.4 1.4 3.1 2.3 0.4 2.5 3.9 2.8 2.3 1.6 4.6 4.5 6.1 3.9 5.1];
rose(theta,10) % 将范围在0~2pi之间的数据划分到10个bin