vlookups
vlookups 查询(参数1)在(参数2)中匹配到的行对应的第(参数3)列的值
- 第一个参数,显然,我们要让100003对应的是H4,这里就输入“H4,” ;
- 第二个参数,这里输入我们要查找的区域(绝对引用),即“$A$2:$F$12,”;
- 第三个参数,“全年总计”是区域的第六列,所以这里输入“6”,就会输入第四季度的项目了;(注意:这里的列数不是EXCEL默认的列数,而是查找范围的第几列)
- 第四个参数,精确查找0/模糊匹配1
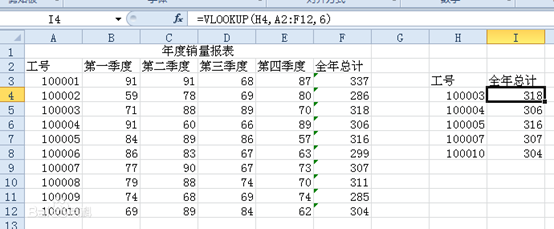
缺点:性能较低
The reason that it’s a simple operation of changing one cell took so long is because this range is used in thousands and thousands of Vlookup expressions, and all of them needed to be calculated. So, vlookups can be slow.
表格的样式快速创建和格式处理
创建数据透视表以分析工作表数据
可直接参考官方案例
实践操作
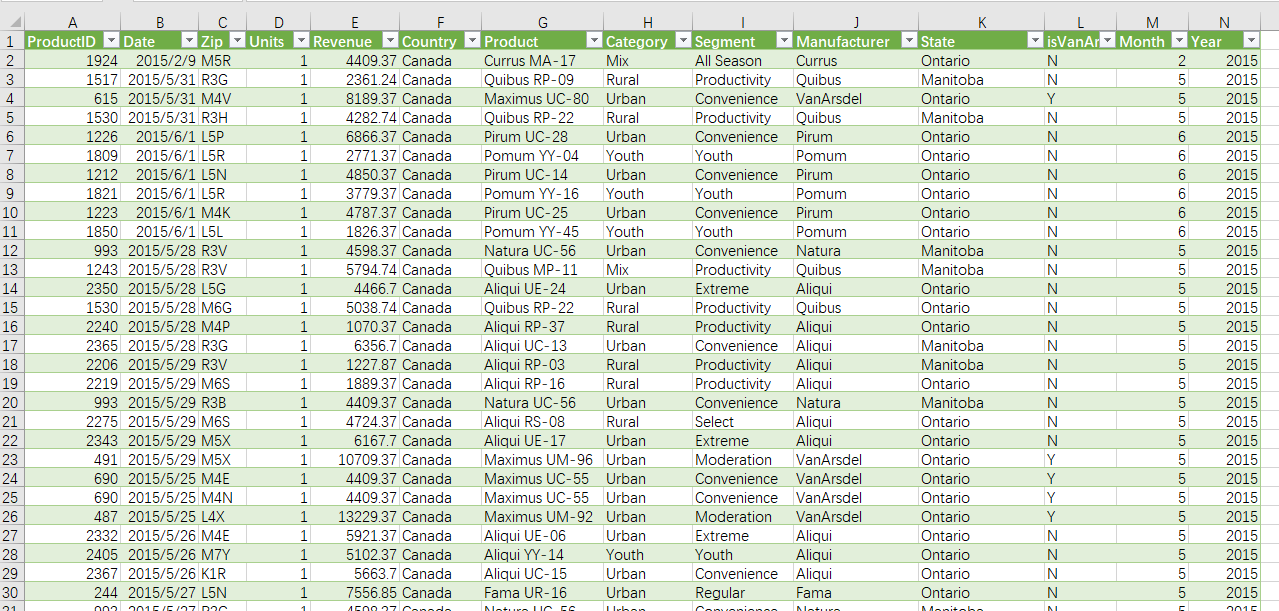
原始数据:
 透视表:
透视表:
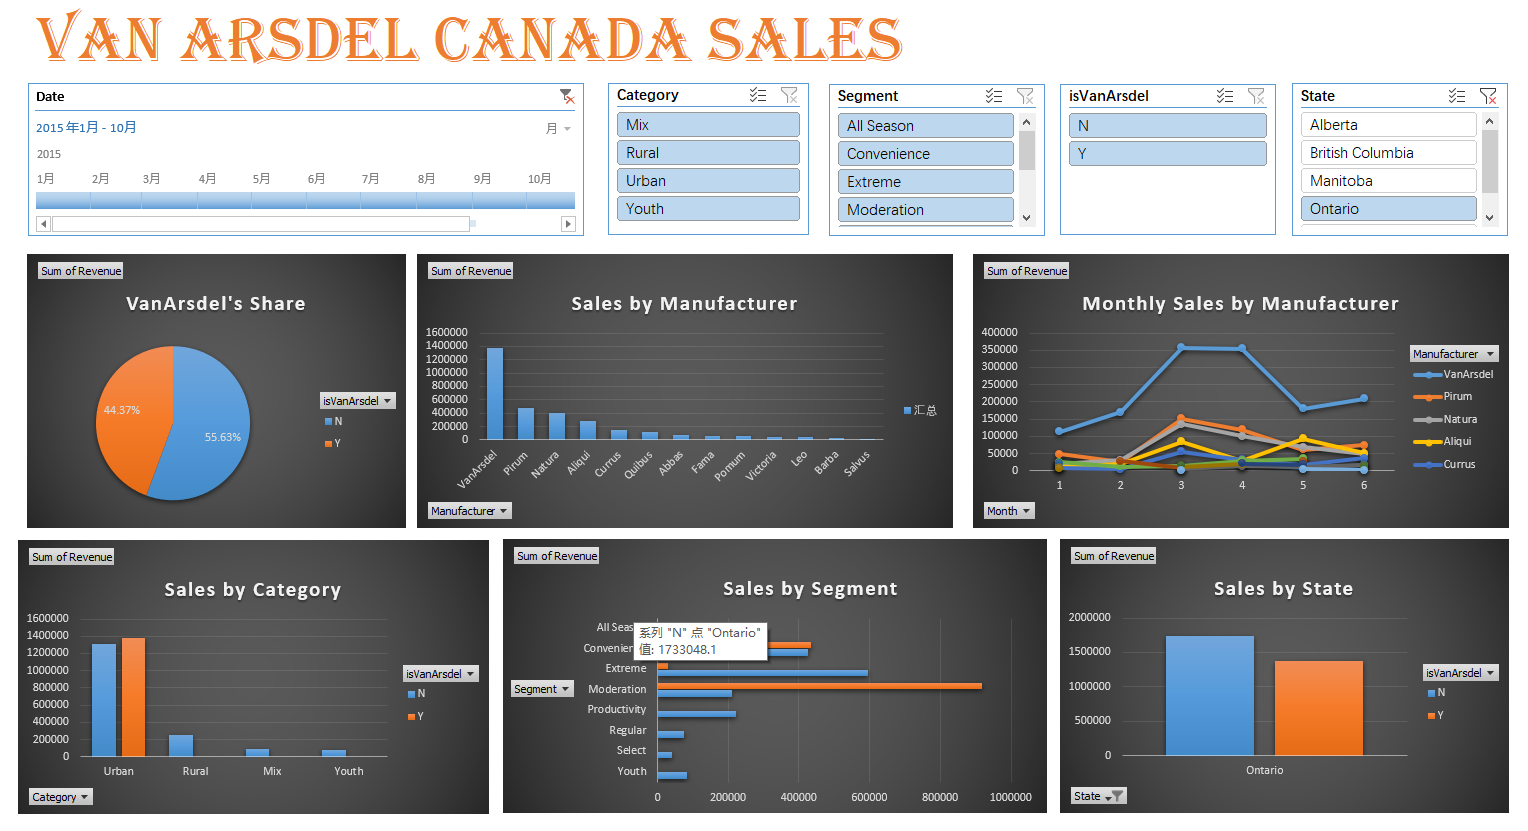
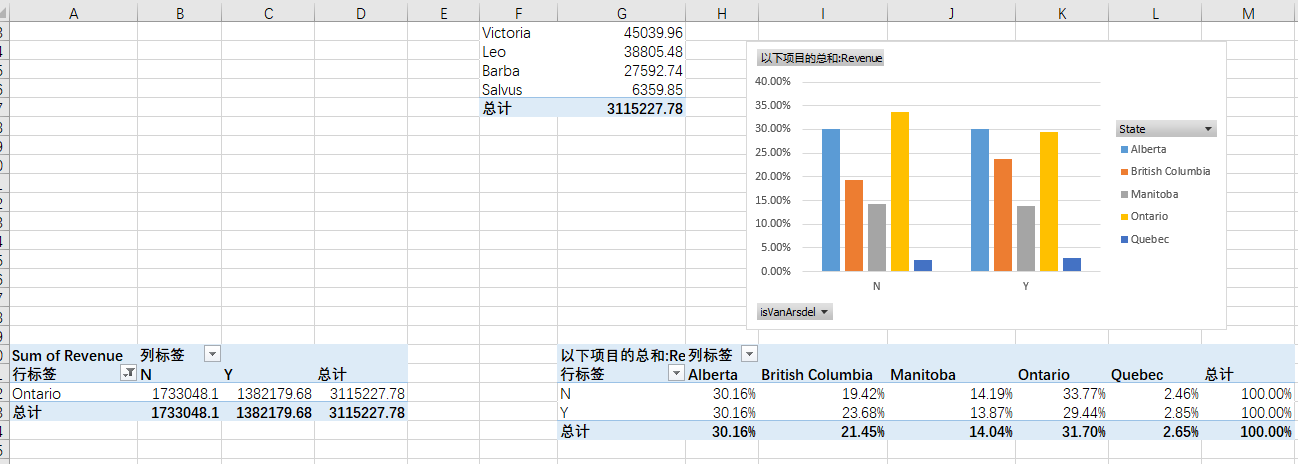 管理看板:
管理看板:
 具体附件:
具体附件:

