常见的三种时间格式:时间戳(timestamp),时期(period),时间间隔(interval)
pandas内置了很多处理时间序列的工具和算法
pandas也支持将时间间隔(interval)作为索引使用,只是本书未提及
1 日期和时间数据类型及用法
除了pandas,本章还会用到datetime(用的最多)、time以及calendar这三个模块
代码示例:
from datetime import datetime
now = datetime.now() # 获取当前时间,返回datetime格式对象
now.year, now.month, now.day # 查询年月日
delta = datetime(2011, 1, 7) - datetime(2008, 6, 24, 8, 15) # 计算时间间隔
delta.days, delta.seconds # 时间间隔可以转化为天数或秒数

from datetime import timedelta
start = datetime(2011, 1, 7)
start + timedelta(12) # 往后推12天
start - 2 * timedelta(12) # 往前推24天(支持四则运算)

datetime(2011, 1, 3).strftime("%Y-%m-%d") # 日期转字符串
datetime.strptime("7/6/2011", "%m/%d/%Y")  # 字符串转日期
import pandas as pd # pandas内置了时间格式解析方法 to_datetime
pd.to_datetime(["2011-07-06 12:00:00", "2011-08-06 00:00:00"])
其他细节补充
datetime模块还有一种特殊的时间格式tzinfo用于存储时区信息- 除了用
%Y-%m-%d表示年-月-日,还常用%H-%M-%S表示时-分-秒 - 对于时间缺失值,pandas会用
NaT(Not a Time)来表示 - 对于时间格式不够规范的字符串,
pd.to_datetime可能存在错误解析的问题
关于datetime与字符串转换时的完整符号表示,可参阅官方文档说明
2 时间序列基础
在pandas中,时间戳常作为索引使用在时间序列数据中,这类索引也叫做DatetimeIndex
代码示例:
dates = [datetime(2011, 1, 2), datetime(2011, 1, 5),
          datetime(2011, 1, 7), datetime(2011, 1, 8),
          datetime(2011, 1, 10), datetime(2011, 1, 12)]
ts = pd.Series(np.random.randn(6), index=dates)
ts.index.dtype # 时间格式的index
ts.index[-2],  # DatetimeIndex支持切片
ts['1/10/2011'], ts['20110110'] # DatetimeIndex也支持灵活的筛选

longer_ts = pd.Series(np.random.randn(1000),
    				  index=pd.date_range('1/1/2000', periods=1000))
longer_ts['2001'] # 筛选2001年份的数据
ts[datetime(2011, 1, 7):datetime(2011, 1, 10)] # 筛选一段时间内的数据

dates = pd.DatetimeIndex(['1/1/2000', '1/2/2000', '1/2/2000',
                           '1/2/2000', '1/3/2000'])
dup_ts = pd.Series(np.arange(5), index=dates) # 带有重复索引的时间序列
dup_ts.index.is_unique # 检验索引的唯一性
dup_ts.groupby(level=0).mean() # 去除重复索引(取均值)
3 日期的范围,频率和平移
代码示例:
# 对于间隔不固定的时序可以指定频率(每天)进行重采样
resampler = ts.resample('D') # 采样不到的日期内会产生缺失值

pd.date_range('2012-04-01', '2012-06-01') # 生成日期范围,默认按天
pd.date_range(start='2012-04-01', periods=20) # 生成20天的日期范围,只指定起始日期
pd.date_range(end='2012-06-01', periods=20) # 生成20天的日期范围,只指定结束日期
pd.date_range('2000-01-01', '2000-05-01', freq='BM') # 指定频率(每个月末)
# 结果是DatetimeIndex(['2000-01-31', '2000-02-29', '2000-03-31',
# '2000-04-28', dtype='datetime64[ns]', freq='BM'])

pd.date_range('2012-05-02 12:56:31', periods=5, normalize=True) # 省略时分秒
pd.date_range('2000-01-01', '2000-01-03 23:59', freq='4h') # 频率为4小时
pd.date_range('2000-01-01', periods=10, freq='1h30min') # 不同频率可以组合
pd.date_range('2012-01-01', '2012-09-01', freq='WOM-3FRI') # 每月第3个星期五

ts = pd.Series(np.random.randn(4),
                index=pd.date_range('1/1/2000', periods=4, freq='M'))
ts.shift(2) # 数据向后平移2天,最前两条数据将缺失
ts.shift(-2) # 数据向前平移2天,最后两条数据将缺失
ts / ts.shift(1) - 1 # 计算每日变化率
ts.shift(2, freq='M') # 数据向后平移2个月

from pandas.tseries.offsets import Day, MonthEnd
now = datetime(2011, 11, 17)
now + 3 * Day() # 直接通过偏移量的加减进行平移
now + MonthEnd(2) # 平移到第二个月的月底:2011-12-31
MonthEnd().rollforward(now) # 往后平移一次:2011-11-30
MonthEnd().rollback(now) # 往前平移一次:2011-10-31
常见的频率包括
D每天、H每小时、T每分、S每秒、L每毫秒,更多频率可参阅官方文档
4 时区处理
一般认为UTC是国际标准时区,其他时区则以UTC偏移量的形式表示的
Python使用第三方库pytz来实现不同时区的信息处理(源数据来自Olson数据库)
代码示例:
import pytz

pytz.common_timezones[-5:] # 最常见的五个时区
pd.date_range('3/9/2012 9:30', periods=10, freq='D', tz='UTC') # 指定时区

rng = pd.date_range('3/9/2012 9:30', periods=6, freq='D')
ts = pd.Series(np.random.randn(len(rng)), index=rng)
ts.tz_localize('UTC') # 指定时区
ts_eastern.tz_convert('Europe/Berlin') # 转换时区

pd.Timestamp('2011-03-12 04:00').tz_localize('utc').tz_convert('America/New_York')
pd.Timestamp('2011-03-12 04:00', tz='utc').tz_convert('America/New_York')
不同时区的数据运算时,会自动转换为标准UTC时区再进行
5 时期及其算术运算
时期(period)表示的是时间区间,比如数日、数月、数年等,对应pandas.Period对象
代码示例:
pd.Period(2007, freq='A-DEC') # 生成一个时期对象,A-DEC表示每年年底(12月份)
pd.period_range("2000-01-01", "2000-06-30", freq="M") # 生成一个时期序列,按月
pd.PeriodIndex(["2001Q3", "2002Q2", "2003Q1"], freq="Q-DEC") # 转换为时期对象,按季

# 不同时期转换 | 按年计算时期也会指定月份(比如A-JUN表示每年6月份)
pd.Period('2007', freq='A-JUN').asfreq('M', 'start') # Period('2006-07', 'M')
pd.Period('2007', freq='A-JUN').asfreq('M', 'end') # Period('2007-06', 'M')
pd.Period("Aug-2011", "M").asfreq("A-JUN") # Period('2012', 'A-JUN')
pd.Period('2007', freq='A-DEC').asfreq("B", how="end") # 每年最后一个工作日
不同时期之间的转换需要考虑低频时期的范围与高频时期的位置:

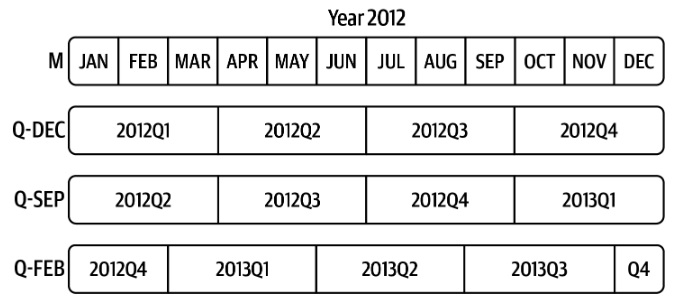
不同领域的季度划分也会存在差异,Python提供了灵活的切分方式:

其他时期处理的常用技巧:
- 使用
to_period和to_timestamp可以将日期与时期进行互相转换 PeriodIndex支持多个列(比如年、季度)组合为一列Period时期对象- 更多
pandas.Period时期对象的选择可参阅官方文档
6 重采样及频率转换
重采样(resampling)指的是将时间序列从一个频率转换到另一个频率的处理过程
将高频率数据聚合到低频率称为降采样(downsampling)
将低频率数据转换到高频率则称为升采样(upsampling)
代码示例:
dates = pd.date_range("2000-01-01", periods=100)
ts = pd.Series(np.random.standard_normal(len(dates)), index=dates)
ts.resample("M").mean() # 按月重采样
ts.resample("M", kind="period").mean() # 按月重采样-时期对象

rng = pd.date_range('2000-01-01', periods=12, freq='T')
ts = pd.Series(np.arange(12), index=rng)
ts.resample('5min', closed='right').sum() # 聚合时包含右边界
ts.resample('5min', closed='right', label='right').sum() # 以右边界作为区间标识
ts.resample('5min').ohlc() # 计算初始值/最高值/最低值/结束值(金融领域常用)
resample过程中闭合边界参数closed与标识参数label的图示:

其他细节说明:
resample方法内置了类似于groupby的分组聚合机制resample方法可以通过参数axis指定需要重采样的轴;也可以通过参数fill_method在升采样时候进行插值;当对周期进行升采样时,还需要借助参数convention指定start/end;参数offset用于指定采样结果的时间偏移量- 当每组只有一个值时,升采样可考虑使用
asfreq方法,其他聚类函数(比如sum/mean)等会导致引入缺失值 - 在降采样中,目标频率必须是源频率的子时期(subperiod)
- 在升采样中,目标频率必须是源频率的超时期(superperiod)
7 移动窗口函数
移动窗口函数(moving window function)代表着时间序列中常用的一种统计运算,比如计算过去一段时间内的均值或方差,也可以是稍微复杂点运算,比如指数加权移动平均等。移动窗口函数运算时会自动舍弃缺失值。
代码示例:
close_px_all = pd.read_csv('examples/stock_px_2.csv', # 读取数据
                            parse_dates=True, index_col=0)
plt.style.use('grayscale')

aapl_px = close_px["AAPL"]["2006":"2007"] # 苹果公司2006~2007年收盘价
ma30 = aapl_px.rolling(30, min_periods=20).mean() # 30日移动平均
ewma30 = aapl_px.ewm(span=30).mean() # 指数加权移动平均
aapl_px.plot(style="k-", label="Price")
ma30.plot(style="k--", label="Simple Moving Avg")
ewma30.plot(style="k-", label="EW MA")
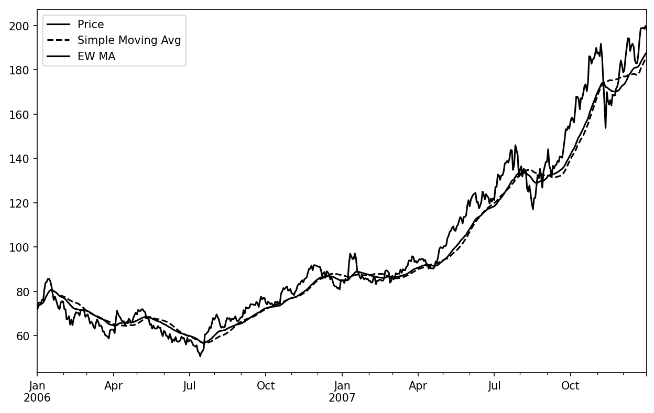
绘图结果(苹果公司股价,30日移动平均,指数加权移动平均):

代码示例:
close_px = close_px_all[["AAPL", "MSFT", "XOM"]]
close_px = close_px.resample("B").ffill() # 缺失填补
spx_rets = close_px_all["SPX"].pct_change() # 计算标普500的每日价格波动
# 移动窗口计算三家公司与标普500的相关系数
corr = close_px.pct_change().rolling(125, min_periods=100).corr(spx_rets)
corr.plot()
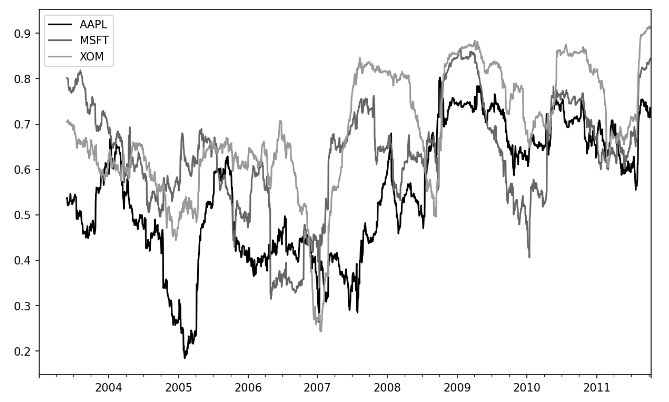
绘图结果(三家公司与标普500的相关系数趋势):

其他细节补充:
- 用
expanding方法替代rolling方法可以取消窗口大小限制(窗口大小随数据量增加而增加) - 用户可以自定义移动窗口函数,只需要确保输入是数组/序列,输出是单个值